Free CFA-Level-II Mock Exam – Practice Online Confidently

Increase your chances of passing the CFA Institute CFA-Level-II exam questions on your first try. Practice with our free online CFA-Level-II exam mock test designed to help you prepare effectively and confidently.

Exam Code: CFA-Level-II
Exam Questions: 713
CFA Level II Chartered Financial Analyst
Updated: 26 Aug, 2026
Question 1

Tamara Ogle, CFA, and Isaac Segovia, CAIA, are portfolio managers for Luca's Investment Management (Luca's). Ogle and Segovia both manage large institutional investment portfolios for Luca's and are researching portfolio optimization strategies.
Ogle and Segovia begin by researching the merits of active versus passive portfolio management. Ogle advocates a passive approach, pointing out that on a risk-adjusted basis, most managers cannot beat a passive index strategy. Segovia points out that there will always be a need for active portfolio managers because as prices deviate from fair value, active managers will bring prices back into equilibrium. They determine that Treynor-Black models permit active management within the context of normally efficient markets.
Ogle decides to implement Treynor-Black models in her practice and starts the implementation process. In conversations with her largest client's risk manager, Jim King, FRM, she is asked about separation theorem in relation to active portfolio management. She responds that separation theorem more properly relates to asset prices deviating from and gravitating toward their theoretical fair price. King next asks Ogle about the differences between the Sharpe ratio and the information ratio and the difference between the security market line (SML) and the capital market line (CML).
After reallocating her client portfolios based on using the Treynor-Black model, Ogle discusses the results with Segovia. Ogle states that she is satisfied with the current methodology, but given her preference for passive management, she is still concerned about relying on analyst's forecasts. Segovia tells Ogle that he will research methods for modifying the Treynor-Black model to account for analyst forecasts.
The optimal risky portfolio determined by the Treynor-Black model has an allocation of 30% to the active portfolio and a Sharpe ratio of 0.45. Given that the risk-free rate is 3%, the standard deviation of the market (passive) portfolio is 20%, and the expected return on the optimal risky portfolio is 10%, the standard deviation of an investor's optimal portfolio that is allocated 70% to the risk-free asset is closest to:

Options :
Answer: A

Question 2

Lena Pilchard, research associate for Eiffel Investments, is attempting to measure the value added to the Eiffel Investments portfolio from the use of 1-year earnings growth forecasts developed by professional analysts.
Pilchard's supervisor, Edna Wilms, recommends a portfolio allocation strategy that overweights neglected firms. Wilms cites studies of the 'neglected firm effect,' in which companies followed by a small number of professional analysts are associated with higher returns than firms followed by a larger number of analysts. Wilms considers a company covered by three or fewer analysts to be 'neglected.'
Pilchard also is aware of research indicating that, on average, stock returns for small firms have been higher than those earned by large firms. Pilchard develops a model to predict stock returns based on analyst coverage, firm size, and analyst growth forecasts. She runs the following cross-sectional regression using data for the 30 stocks included in the Eiffel Investments portfolio:
Ri = b0 + b,COVERAGEi + b2 LN(SIZEi) + b3(FORECASTi) + ei
where:
Ri = the rate of return on stock i
COVERAGEi = one if there are three or fewer analysts covering stock
i, and equals zero otherwise
LN(SIZEi) = the natural logarithm of the market capitalization
(stock price times shares outstanding) for stock i,
units in millions
FORECASTi = the 1-year consensus earnings growth rate forecast for stock i

Pilchard derives the following results from her cross-sectional regression:

166

The standard error of estimate in Pilchard's regression equals 1.96 and the regression sum of squares equals 400.
Wilrus provides Pilchard with the following values for analyst coverage, firm size, and earnings growth forecast for Eggmann Enterprises, a company that Eiffel Investments is evaluating.

169


Pilchard derives the ANOVA table for her regression. In her ANOVA table, the degrees of freedom for the regression sum of squares and total sum of squares should equal:

Options :
Answer: C

Question 3

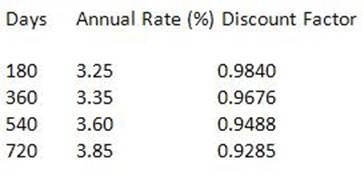
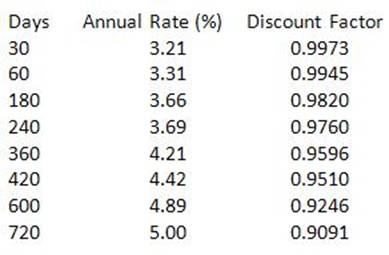
William Bow, CFA, is a risk manager for GlobeCorp, an international conglomerate with operations in the technology, consumer products, and medical devices industries. Exactly one year ago, GlobeCorp, under Bow's advice, entered into a 3-year payer interest rate swap with semiannual floating rate payments based on the London interbank offered rate (LIBOR) and semiannual fixed rate payments based on an annual rate of 2.75%. At the time of initiation, the swap had a value of zero and the notional principal was set equal to $150 million. The counterparty to GlobeCorp's swap is NVS Bank, a commercial bank that also serves as a swap dealer. Exhibit 1 below summarizes the current LIBOR term structure.

19

Upper management at GlobeCorp feels that the original swap has served its intended purpose but that circumstances have changed and it is now time to offset the firm's exposure to the swap. Because they cannot find a counterparty to an offsetting swap transaction, management has asked Bow to come up with alternative measures to offset the swap exposure. Bow created a report for the management team which outlines several strategies to neutralize the swap exposure. Two of his strategies are included in Exhibit 2.

26

After examining its long-term liabilities, NVS Bank has decided that it currently needs to borrow $100 million over the next two years to finance its operations. For this type of funding need, NVS generally issues quarterly coupon short-term floating rate notes based on 90-day LIBOR. NVS is concerned, however, that interest rates may shift upward and the LIBOR curve may become upward sloping. To manage this risk, NVS is considering utilizing interest rate derivatives. Managers at the bank have collected quotes on over-the-counter interest rate caps and floors from a well known securities dealer. The quotes, which are based on a notional principal of $100 million, are provided in Exhibit 3.

27

One of the managers at NVS Bank, Lois Green, has expressed her distrust of the securities dealer quoting prices on the caps and floors. In a memo to the CFO, Green suggested that NVS use an alternative but equivalent approach to manage the interest rate risk associated with its two-year funding plan. Following is an excerpt from Green's memo:
'Rather than using a cap or floor, NVS Bank can effectively manage its exposure to interest rates resulting from the 2-year funding requirement by taking long positions in a series of put options on fixed-income instruments with expiration dates that coincide with the payment dates on the floating rate note.'
'As a cheaper alternative, NVS can effectively manage its exposure to interest rates resulting from the 2-ycar funding requirement by creating a collar using long positions in a series of call options on interest rates and long positions in a series of call options on fixed income instruments all of which would have expiration dates that coincide with the payment dates on the floating rate note.'
GlobeCorp is concerned with its exposure to the interest rate swap initiated one year ago. Evaluate the strategies recommended by Bow in Exhibit 2.

Options :
Answer: A

Question 4

In 2001, Continental Supply Company was formed to provide drilling equipment and supplies to contractors and oilfield production companies located throughout the United States. At the end of 2005, Continental Supply created a wholly owned foreign subsidiary, International Oilfield Incorporated, to begin servicing customers located in the North Sea. International Oilfield maintains its financial statements in a currency known as the local currency unit (LCU). Continental Supply follows U .S . GAAP and its presentation currency is the U .S . dollar.
For the years 2005 through 2008, the weighted-average and year-end exchange rates, stated in terms of local currency per U .S . dollar, were as follows:

1

International Oilfield accounts for its inventory using the lower-of-cost-or-rnarlcet valuation method in conjunction with the first-in, first-out, cost flow assumption. All of the inventory on hand at the beginning of the year was sold during 2008. Inventory remaining at the end of 2008 was acquired evenly throughout the year.
At the beginning of 2006, International Oilfield purchased equipment totaling LCU975 million when the exchange rate was LCU 1.00 to SI. During 2007, equipment with an original cost of LCU 108 million was totally destroyed in a fire. At the end of 2007, International Oilfield received a LCU 92 million insurance settlement for the loss. On June 30, 2008, International Oilfield purchased equipment totaling LCU 225 million when the exchange rate was LCU 1.25 to $1.
For the years 2007 and 2008, Continental Supply reported International Oilfield revenues in its consolidated income statement of S375 million and $450 million, respectively. There were no inter-company transactions. Following are International Oilfield's balance sheets at the end of 2007 and 2008:

2

At the end of 2008, International Oilfield's retained earnings account was equal to $525 million and, to date, no dividends have been paid. All of International Oilfield's capital stock was issued at the end of 2005.
Assuming International Oilfield is a significantly integrated sales division and virtually all operating, investing, and financing decisions are made by Continental Supply, foreign currency gains and losses that arise from the consolidation of International Oilfield should be reported in:

Options :
Answer: C

Question 5

Austin Clark, CFA, has been asked to analyze White Goods Corporation, a $9 billion company that owns a nationwide chain of stores selling appliances and other electronic goods. As part of his analysis of the White Goods Corporation, Clark's supervisor, David Horvath, asks Clark to forecast White Goods' 2009 sales using multiple regression analysis. The following model was developed:
sales = 20.1 + 0.001 GDP+ 1,000.6 TR + 0.1 CC -3.2 PC -40.3 UR
t-values: (1.1) (2.3) (1.75) (3.2) (-0.48) (-0.9)
Number of observations: 76
Standard error estimate: 15.67
Unadjusted R2: 0.96
Regression sum of squares: 412,522
Error sum of squares: 17,188
Independent Variable Descriptions
GDP = gross domestic product
TR = average coupon rate on 5-year U .S . Treasury securities
CC = most recent quarter end consumer confidence index value
PC = previous year's sales of personal computers
UR = most recent quarter end unemployment rate
Variable Estimates for 2009
GDP =8,000
TR = 0.05
CC =97
PC = 60,000
UR = 0.055

Critical Values For Student's t-Distribution

139

Clark's supervisor asks him to prepare a report explaining the implications of the regression analysis results. Clark writes the following conclusions concerning regression analysis in his report:
Interpreting the results of regression analysis can be problematic if certain assumptions of the ordinary least squares framework are violated. The regression output for White Goods Corporation is unreliable for the following reasons:
Finding 1: The correlation between regression errors across time is very close to 1.
Finding 2: There is a strong relationship between the regression error variance and the regression independent variables.
In this multiple regression equation, a potential statistical issue is:

Options :
Answer: B

Viewing Page : 1 - 72
Practicing : 1 - 5 of 713 Questions

© Copyrights FreeMockExams 2026. All Rights Reserved

We use cookies to ensure that we give you the best experience on our website (FreeMockExams). If you continue without changing your settings, we'll assume that you are happy to receive all cookies on the FreeMockExams.